Project overview

The United Nations (UN) in the 2030 Agenda for Sustainable Development, established the 17 Sustainable Development Goals (SDGs). These goals consist of Targets and Indicators, which being essentially statistical measures, express the dynamics of individual systems and thematic areas. The urgent need to measure progress towards these Goals has led to a proliferation of Indicators, and an ever-increasing need for observations and data. A promising solution to this problem lies in the use of “Essential Variables” (EVs). This term has been used in recent years to identify the minimum set of variables that will allow a concise but representative description of an Index.
For 29 out of the 230 UN SDGs Indicators that are required to be calculated for each country, part or all of their constituting EVs can be extracted from satellite data. In addition, satellite data will contribute indirectly to the implementation of 71 other Goals, in combination with other data (e.g. national statistics). It is necessary for Indicators to be calculated on different scales (local, national and global), so different approaches to the problem of calculating EVs are required each time. It is also necessary for Indicators to be calculated at regular intervals, to monitor the progress towards the implementation of SDGs. This repeatability requires the development of workflows that will use free data, in order to minimize costs. Recent advances in science and technology have led to the explosive growth of remote sensing satellites and free satellite data. This data must be used in the most optimal way, taking into account their characteristics (spectral, spatial, radiometric and temporal) as well as the requirements for the information that needs to be extracted from them. Cloud Computing technologies, along with Parallel Processing Systems, have surpassed traditional computing techniques, enabling the exploitation of this vast data amount, while simultaneously exploiting data of different time periods (time-series), and data of different scales (multi-scale). Modern remote sensing applications have shifted from single image processing to the processing of multi-temporal and multi-scale images, from various sources. This data can be merged and represented in the form of a 4D “Data Cube”, with the first 2 dimensions being spatial dimensions, the 3rd dimension being the spectral resolution and 4th dimension being the time component.
Research Objectives
The objectives of this study include:
- The development of methodologies for calculating and mapping two SDG Indicators (11.7.1 and 15.3.1), together with the EVs they are comprised of, at the national level for Greece.
- The development of efficient workflows for national scale mapping.
- The exploitation of the latest and free satellite remote sensing data, with improved features (spectral, spatial, radiometric and temporal resolution).
- The exploration of new algorithms and ways to use multiple data in the form of Data Cubes, through Cloud Computing services.
In more detail …
Indicator 11.7.1 is associated with sustainability in cities and is defined as “Average share of the built-up area of cities that is open space for public use for all, by sex, age and persons with disabilities. Indicator 15.3.1 on the other hand, is defined as “Proportion of land that is degraded over total land area” and is related to sustainability of terrestrial ecosystems. The UN provides a proposed methodology for many of the SDG Indicators, including the ones to be computed in this study. According to these, the EVs that need to be calculated/mapped herein are, for 11.7.1: a) build-up area, b) urban open spaces and c) total area of roads, and for 15.3.1: a) land cover and its change, b) net primary production and c) soil organic carbon. Thus, the problem of mapping these indicators nationwide is reduced to mapping the above six EVs.


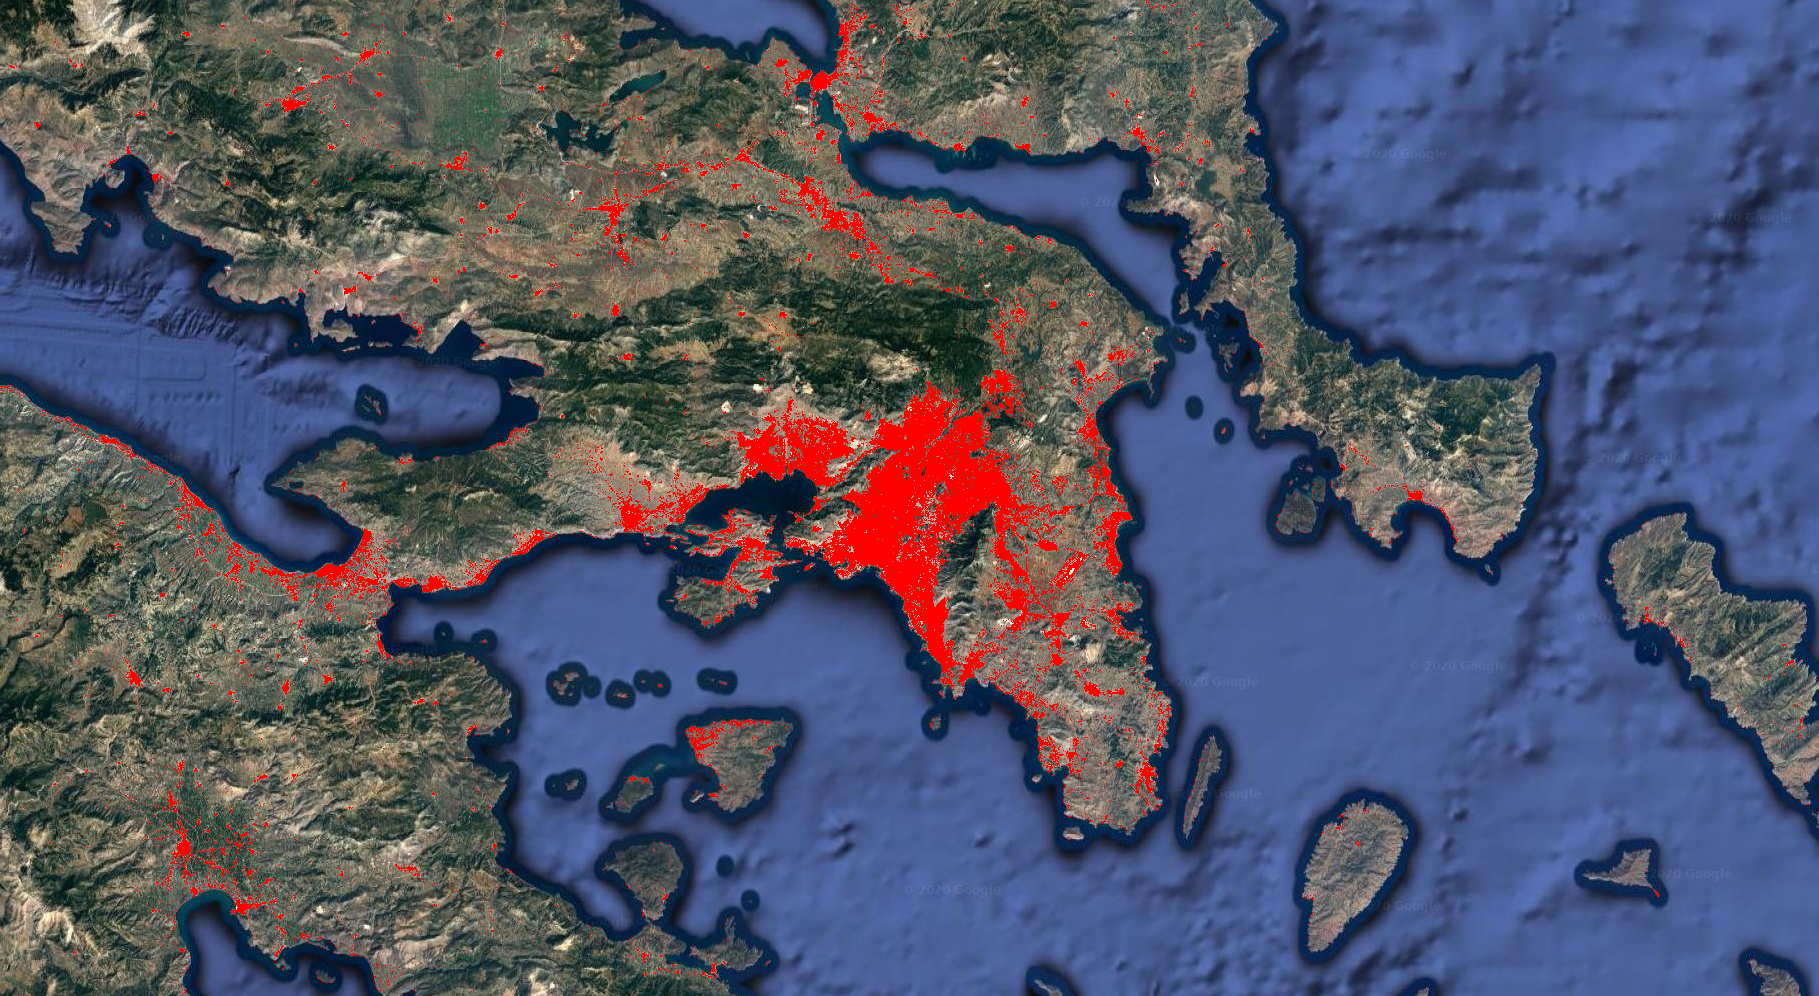
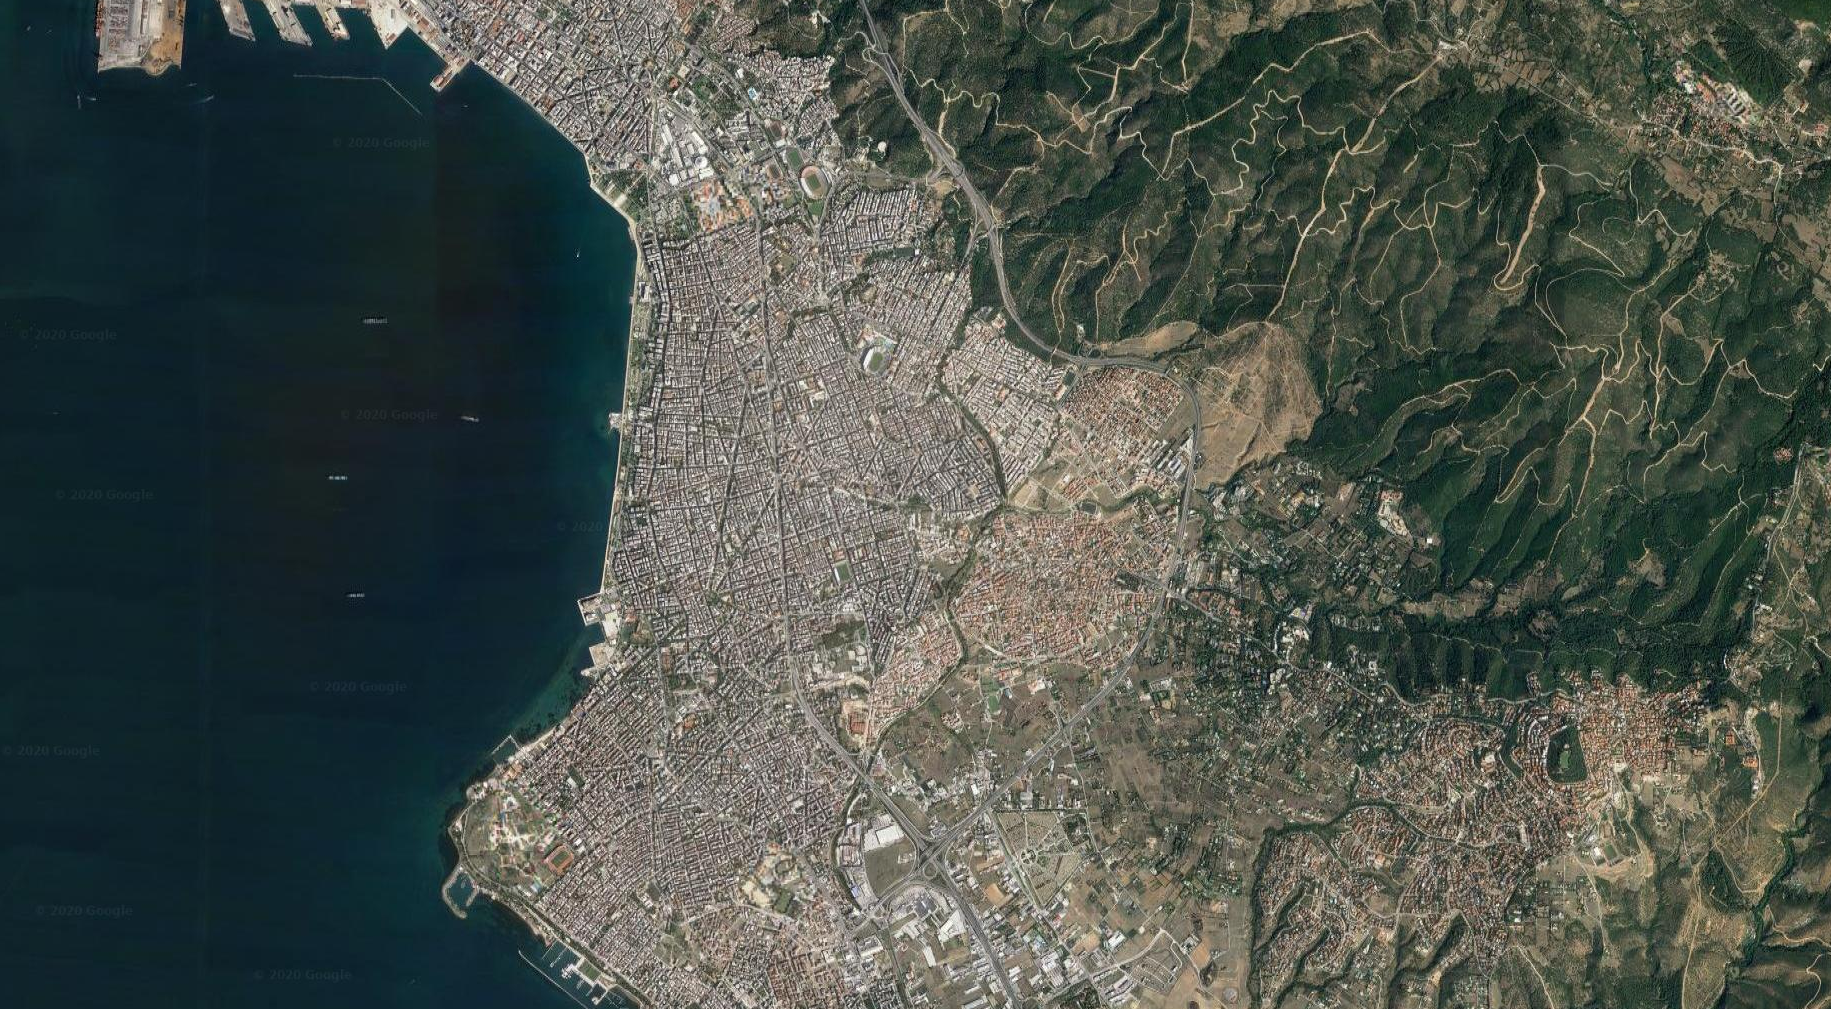
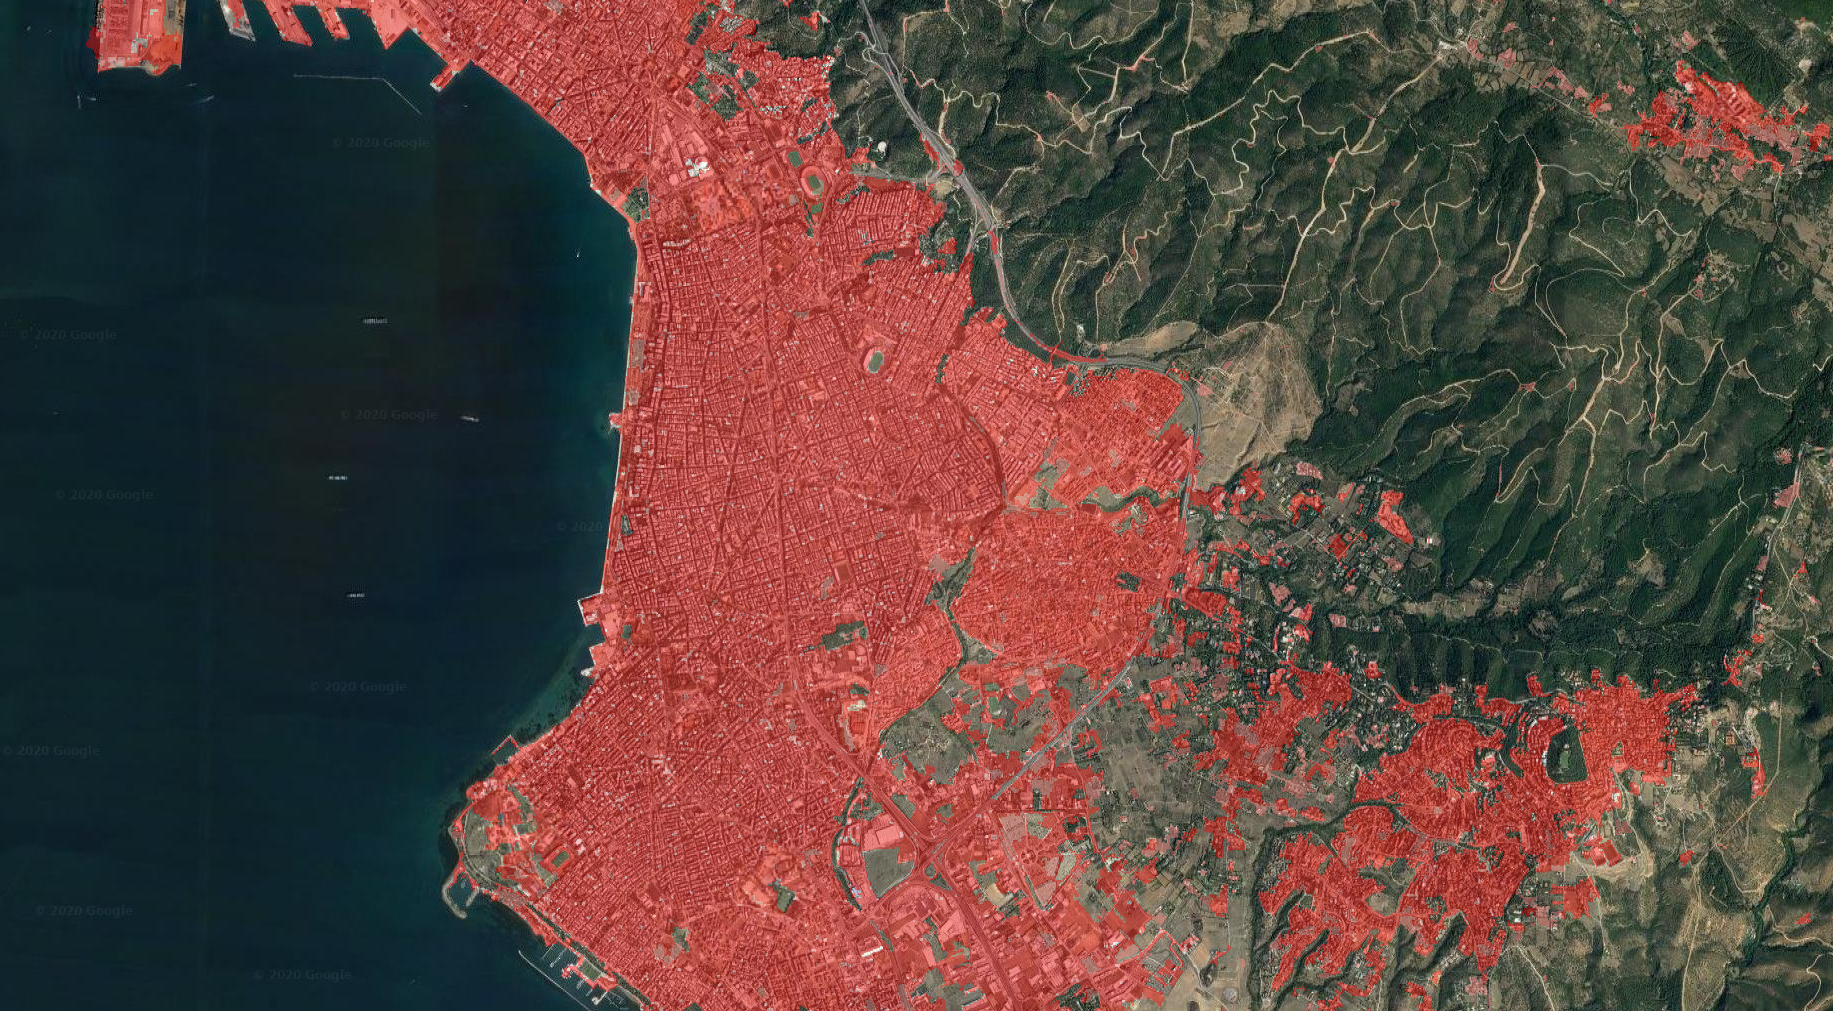
Indicator 11.7.1: “Average share of the built-up area of cities that is open space for public use for all, by sex, age and persons with disabilities”
With regard to Indicator 11.7.1, mapping the EV “built-up area” using Remote Sensing, has been widely investigated in literature however, at large scales, it has either been done with low resolution free data or with very high resolution commercial data. With the emergence of the European Space Agency’s Sentinel satellites, providing free data with resolutions up to 10m, new opportunities emerge for urban mapping. Given the fact that Sentinels provide continuous optical and radar data, research to combine time series of multi-sensor data for built-up area mapping is still an ongoing process. Research related to “urban open spaces” mapping has focused mainly on green and bare land, while the possibility of using digital surface models remains unexplored and has been used mostly for locating buildings, rather than mapping open urban spaces or road surface. “Total area of roads” or in other words “road surface”, still remains a challenge for mapping with free satellite data, mostly because of the spatial resolution free satellite data offers. UN guidelines, however, suggest simply digitizing the roads for Indicator 11.7.1.
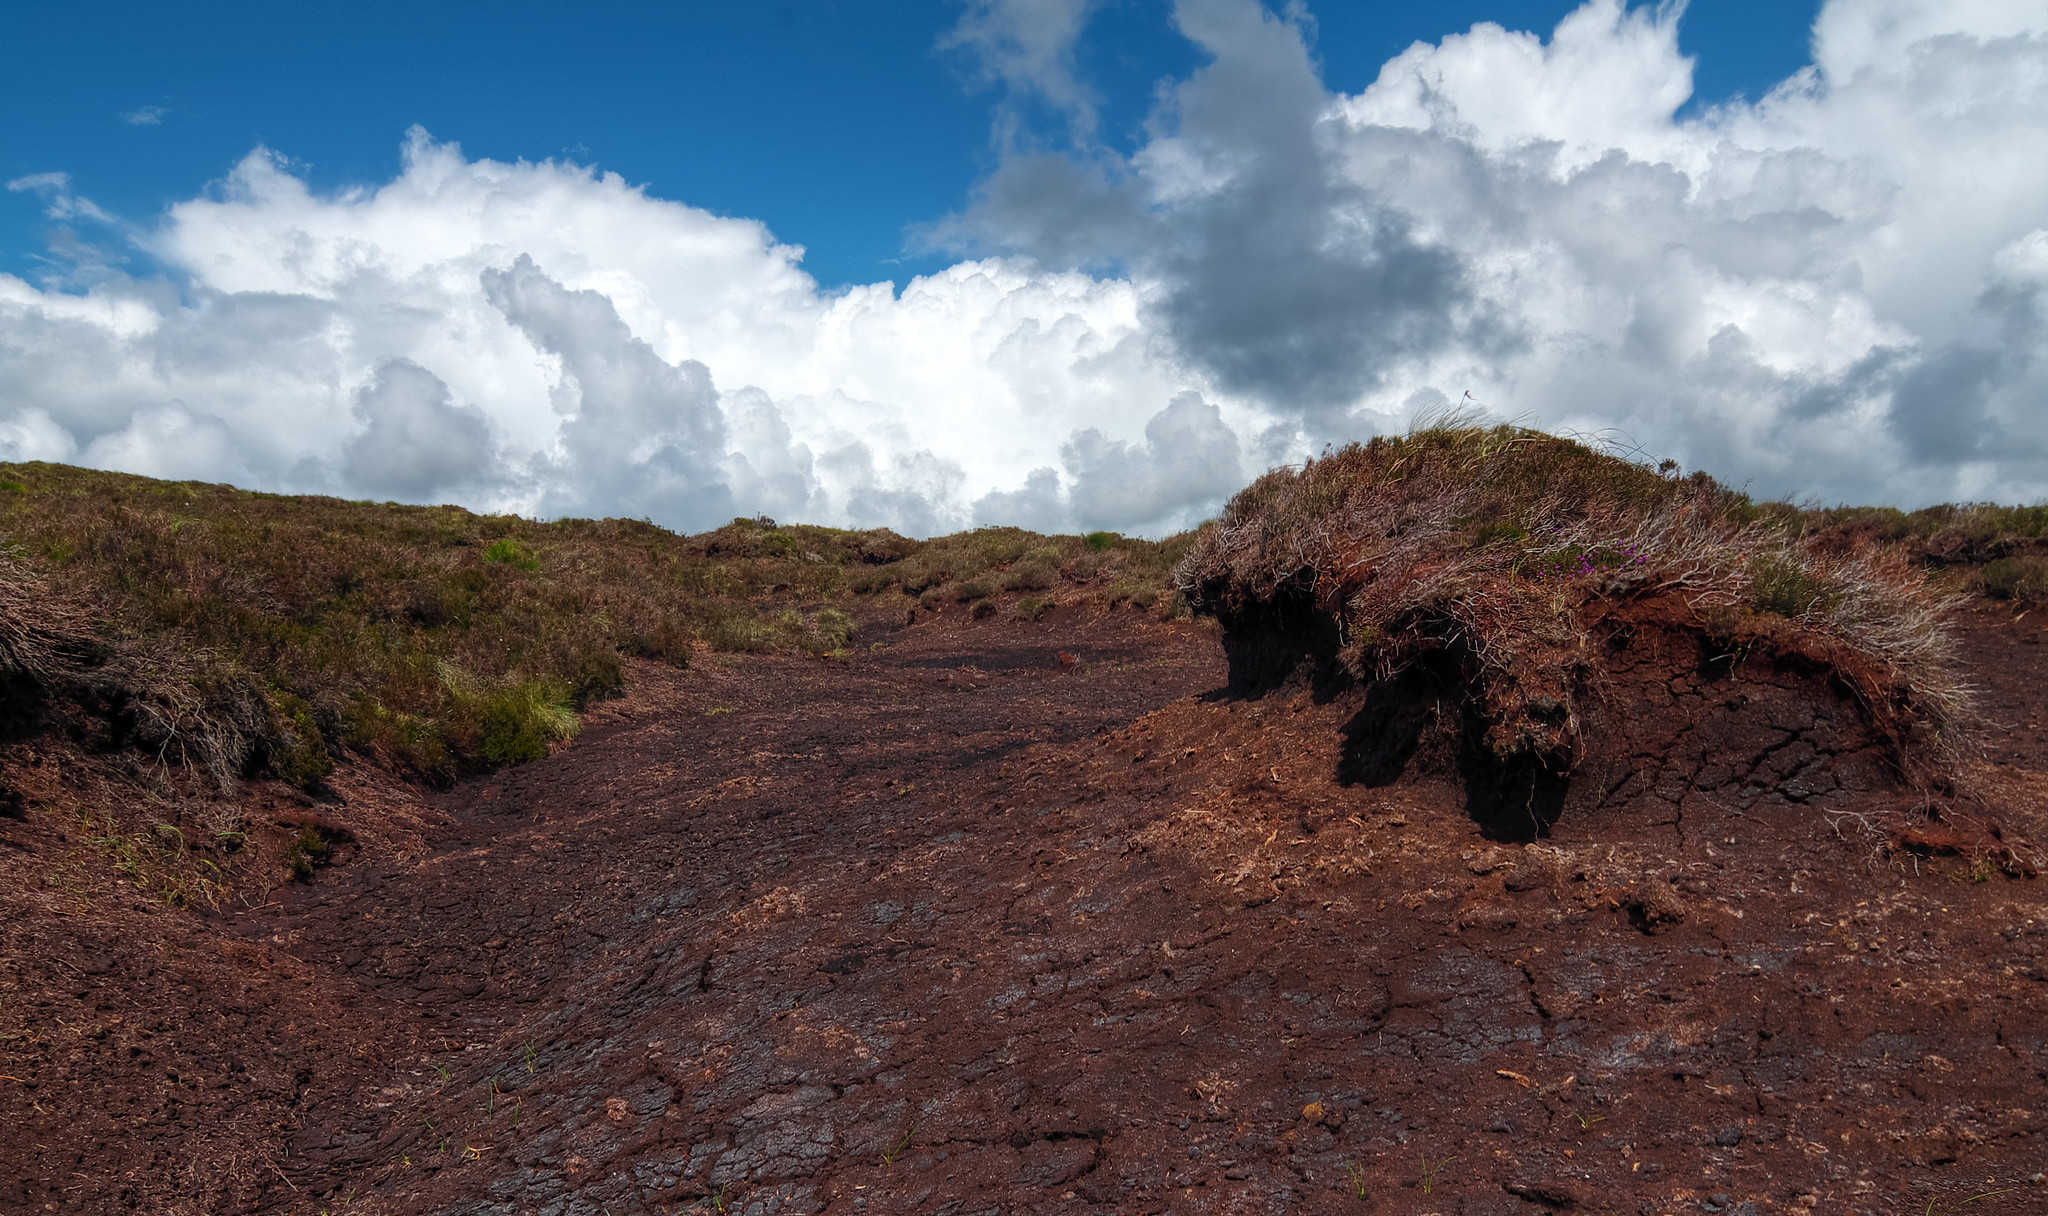
Indicator 15.3.1: “Proportion of land that is degraded over total land area”
Indicator 15.3.1 was fully mapped at the national level for Germany, recently. Land degradation in general, has also been mapped before, at a national scale, though without taking into account the EV of “organic soil carbon”, as suggested by the UN, and lacking accuracy assessment. From the EVs that constitute Indicator 15.3.1, “land cover” is perhaps the most interesting and the most studied variable in remote sensing, and is still being studied extensively, since data and techniques are constantly evolving. In addition, “land cover” is a generic term, intersecting with multiple domains and EVs and is highly dynamic, requiring frequent updates.
Overall, although science and technology have considerably improved data acquisition methods, pre-processing and classification methods, remote sensing is still evolving. The constant need for providing information of higher precision and accuracy, in a continuous time manner, creates new challenges and new trends. In the next years, big data analysis in Remote Sensing, with the use of “Data Cubes” and “Deep Learning” techniques, will slowly replace traditional methods and become the norm. Furthermore, mapping at national scales and at regular intervals, required by the UN, introduces new challenges, such as data volume handling, landscape variability and reference data collection, all of which need to be conquered in this study.